The EYE-TA Summary Report provides the district with summarized results of the assessments made. This report consists of 5 different data aspects to provide you with the progress of your district.
- Demographic Profile
- Skill Development
- Responsive Tiered Instructions (RTI)
- District and School Report Tables represented as number totals
- District and School Report Tables are represented as Percentage totals
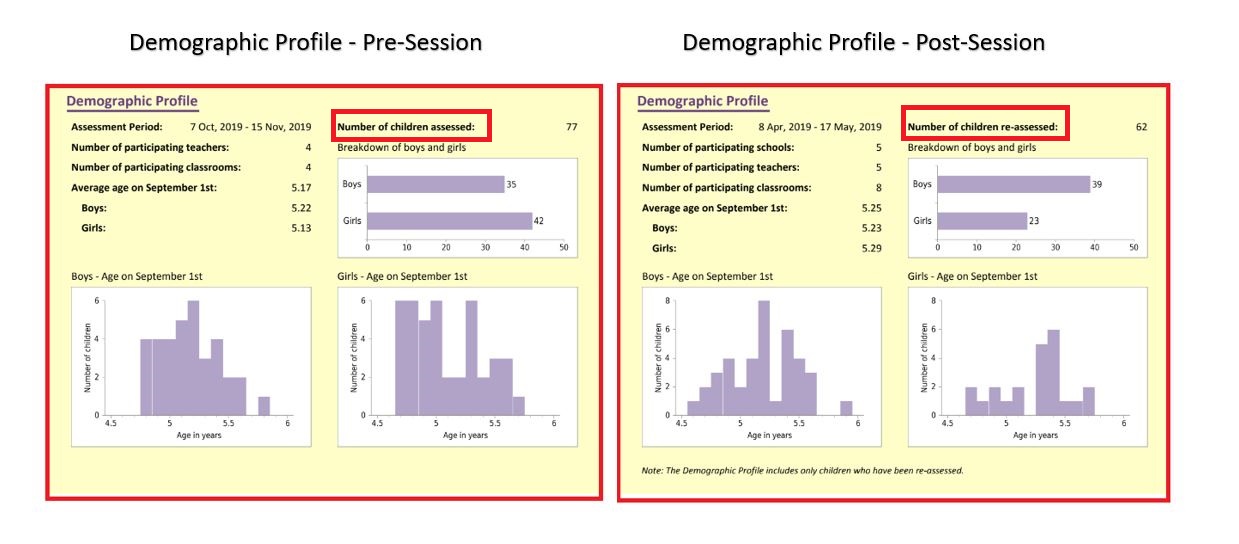
Demographic Profile
This information provides an overview of the characteristics of the entire assessment made. It includes the following:
- Assessment Period - the start and the end date of your session.
- Number of children assessed -(pre-session) the number of children assessed during the (pre-session) which happens during the Fall.
- Number of children re-assessed - (post-session) the number of children who were re-assesed . These students were carried over from the pre-session and had RTI scores that were yellow and green.
Read the Knowledge Base article Why does my post EYE-TA Summary Report show 2 different participant totals? to learn more.
- Number of participating schools - the number of schools who participated in either the pre or the post-session.
- Number of participating classrooms - the number of classrooms that were created within your session.
- Breakdown of Boys and Girls - the overall count of children based on their gender.
- Average age on September 1st - average age of the children assessed, this number is then also broken down to both the Boys and Girls' average age.
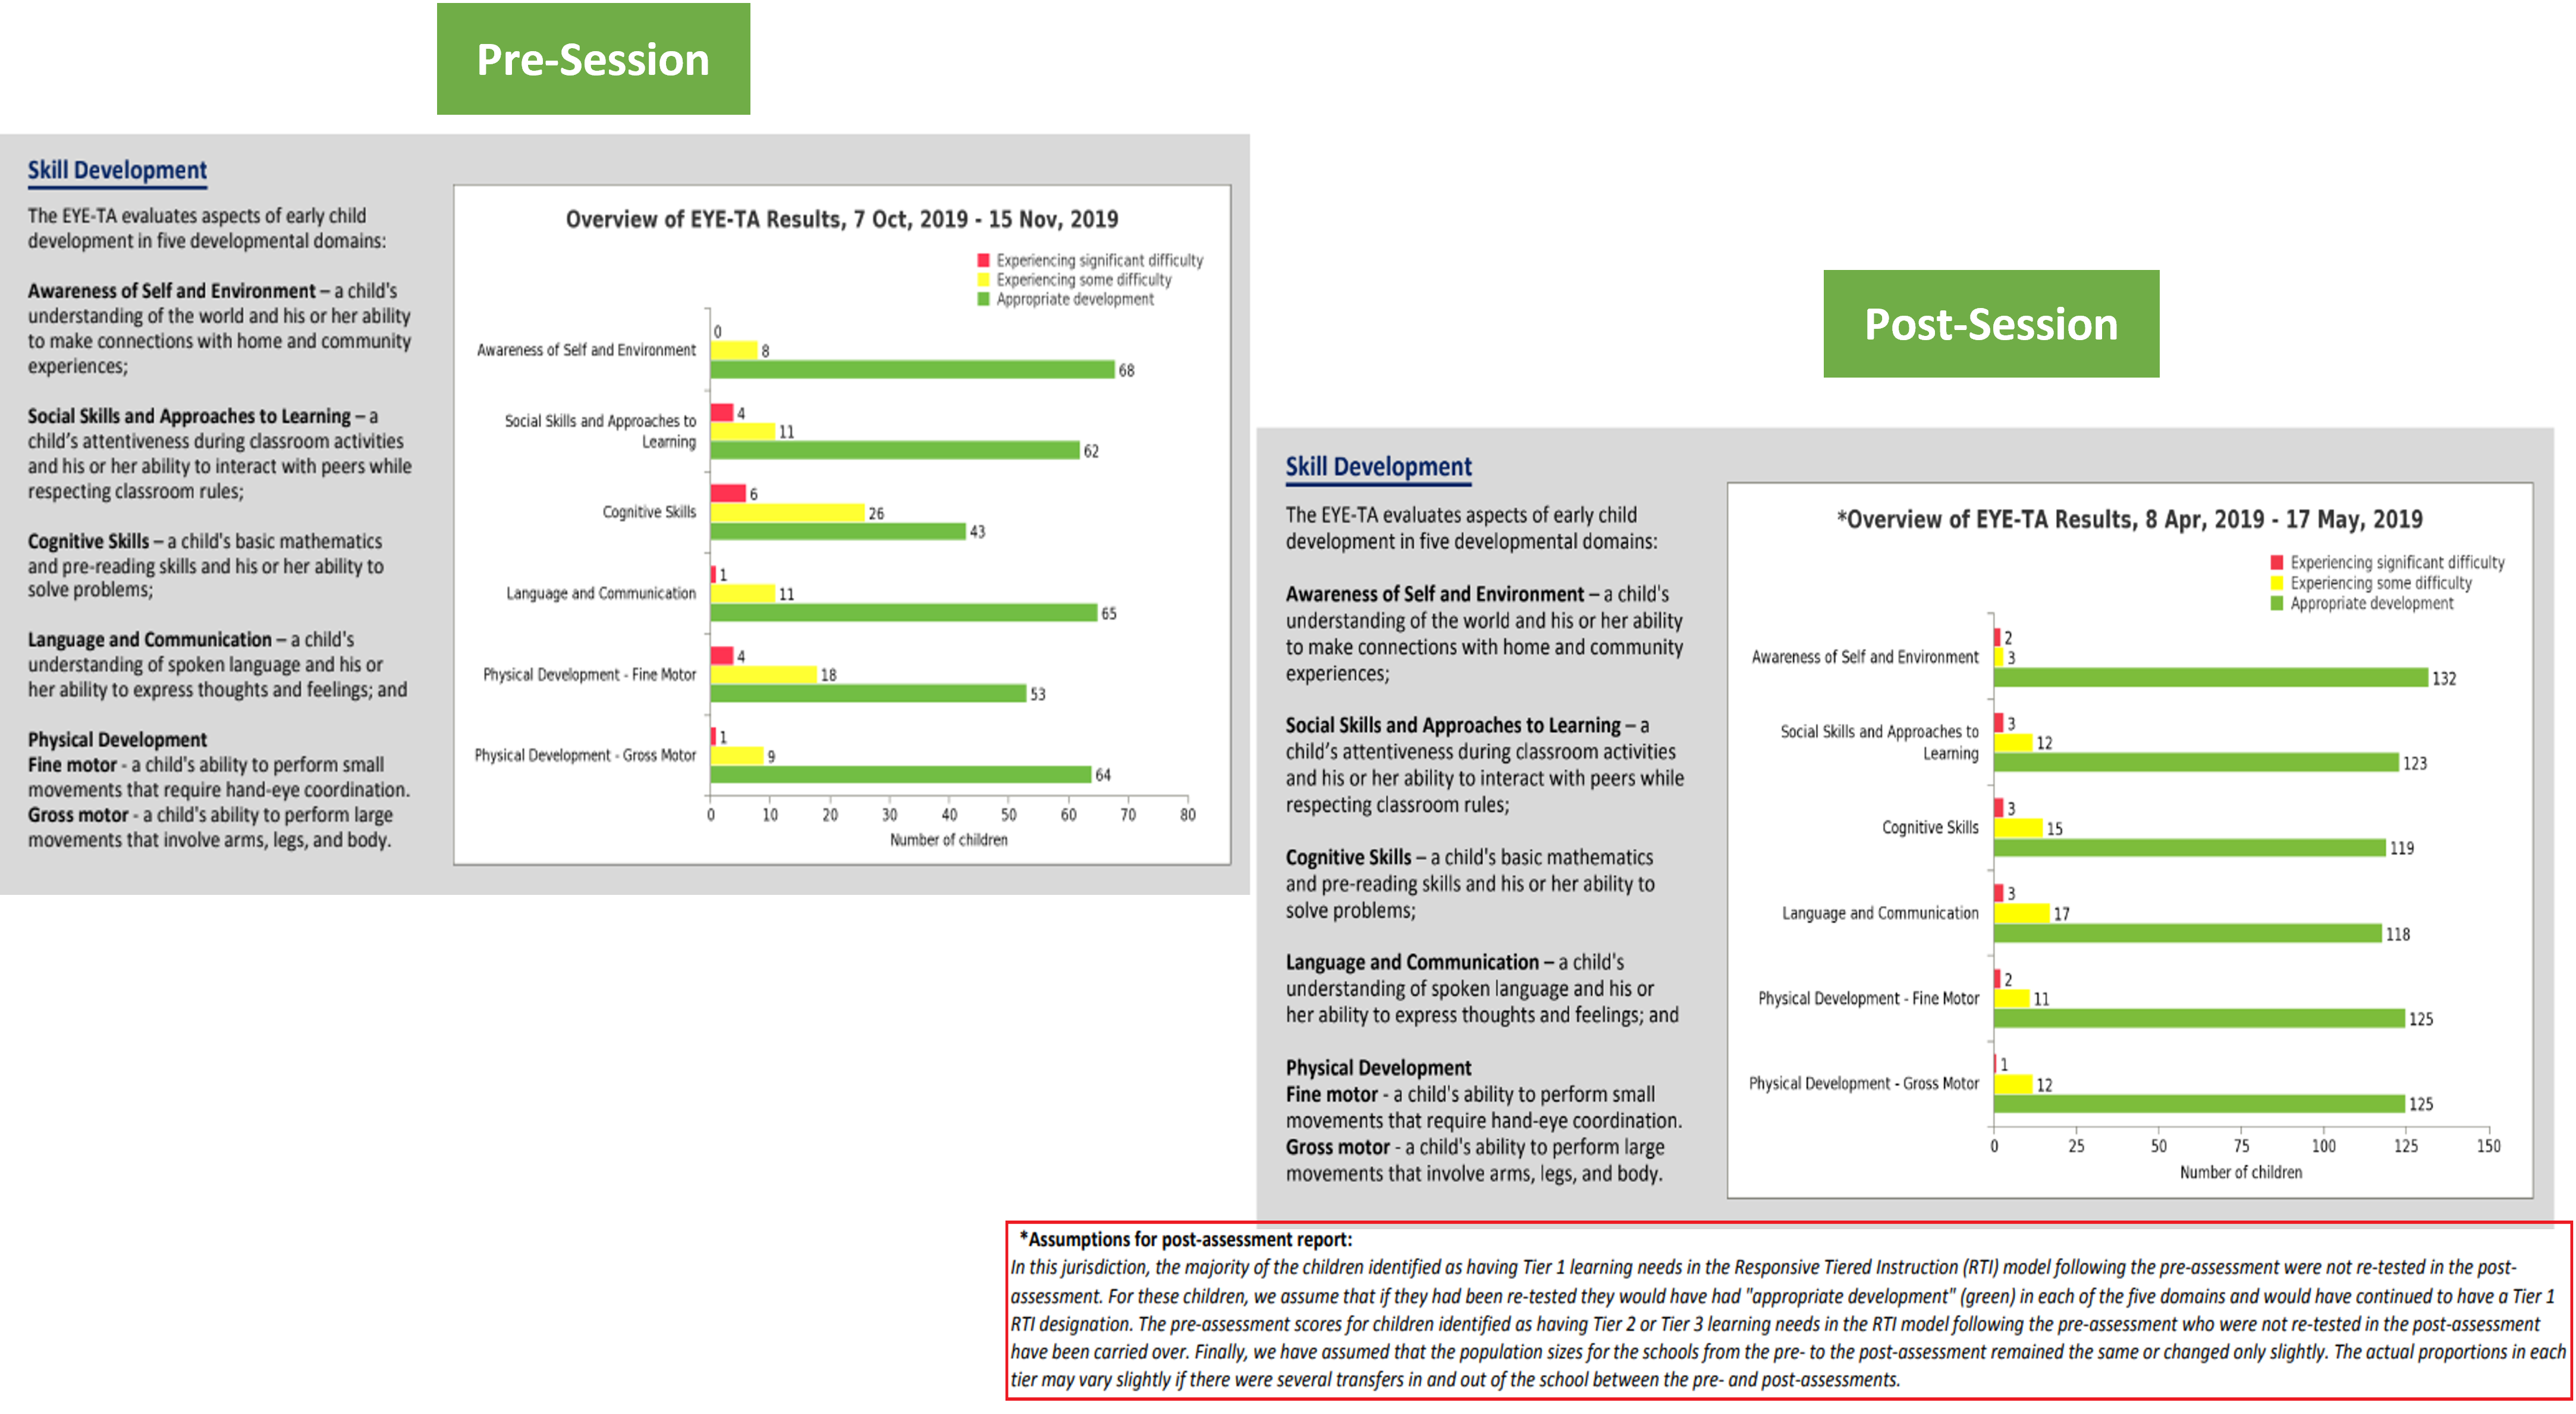
Skill Development
This bar chart shows the number of students assessed based on the five developmental domains: Awareness of Self and Environment, Social Skills and Approaches to Learning, Cognitive Skills, Language and Communication, Physical Development, and Gross Motor. The difference between the pre and post-session view is that the post-session summary report includes the children that were carried over from their pre-assessment. A description is written below the Post-Session chart to provide coordinators with more context about the data being collected.
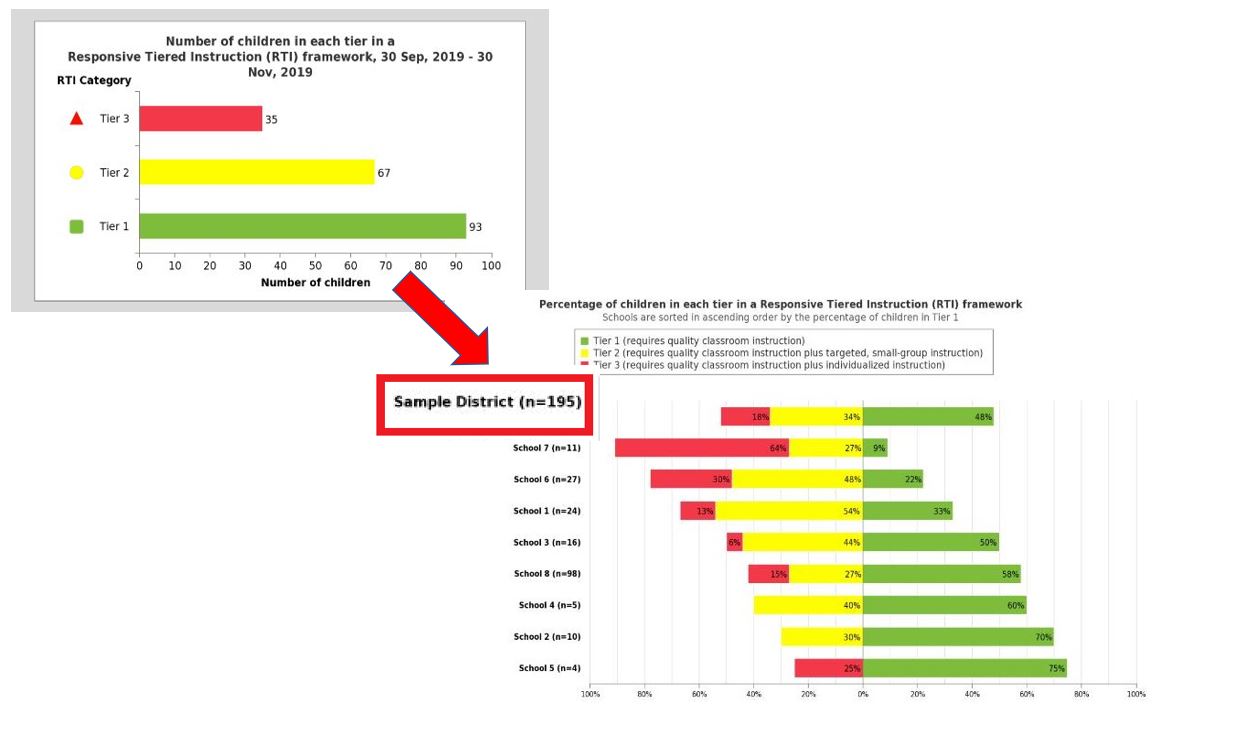
Responsive Tiered Instruction (RTI)
This data shows the overall results of the children assessed based on their RTI results. This is a tiered approach to instruction that is comprised of a continuous assessment of children’s progress in the regular classroom setting with additional support for children who have learning difficulties or behavioural challenges. For more information about RTI, please refer to the article Responsive Tiered Instruction (RTI) found in the Knowledge Base. The difference between the pre and post-assessments is that the post-summary report already includes data of the children that were carried over from their previous session. This data also includes the RTI Framework in percentage format of all participating schools.
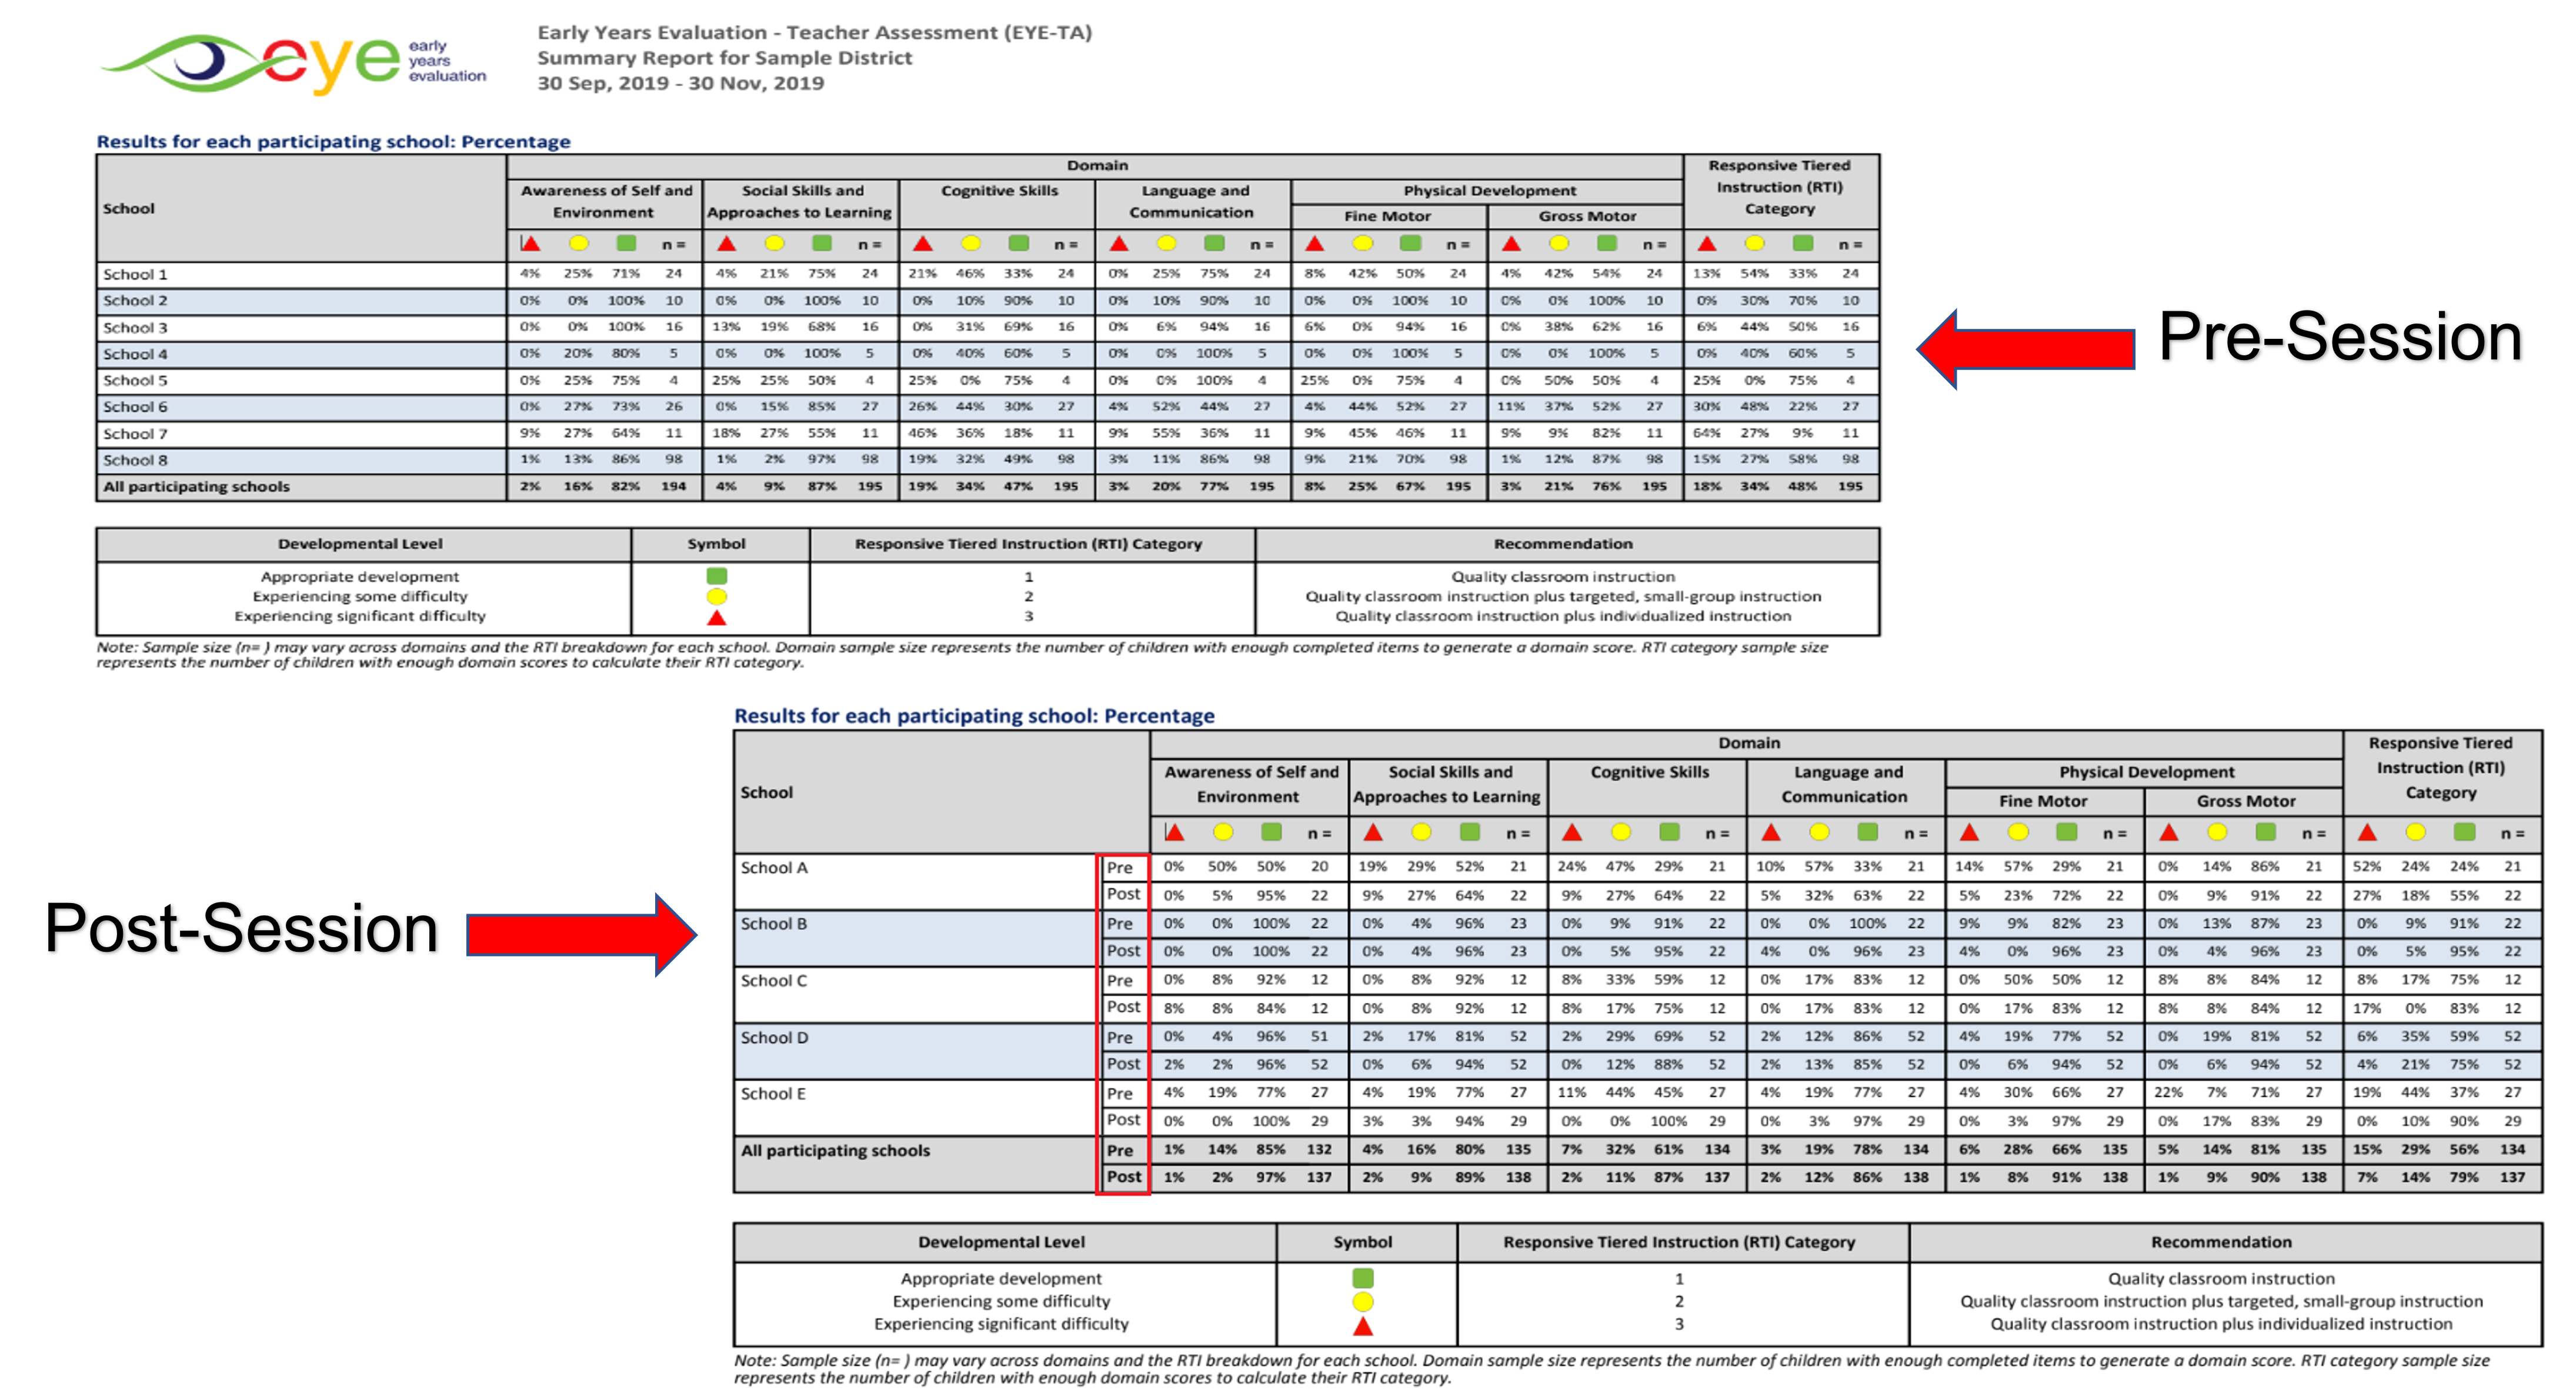
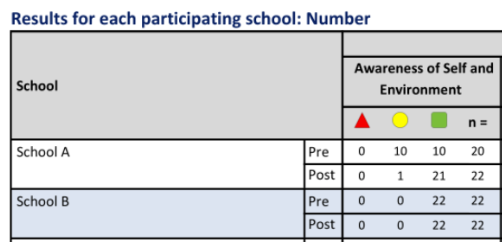
District and School Report Tables
These tables show the breakdown of the results for each of the participating schools. In the first table, the EYE-TA assessment results are represented as numbers.
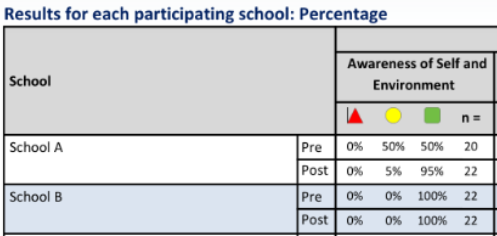
In the second table, the EYE-TA assessment results are represented as percentages.
You can read more in our Knowledge Base article about the Pre-Post results in school-and district-level report tables.
For a quick comparison, the pre-session results are shown next to the post-session. This way coordinators can easily see the differences, as well as the progress made by each school during the entire cycle of EYE-TA administration.