
The post-assessment Summary Report for the EYE-TA presents information in several different ways that may be used for jurisdiction-level analysis. As such, you may have found yourself confused at one point or another by statistics outlining the number of children who participated in the assessment.
For more information on the EYE-TA Summary Report, please review the article: Understanding your post EYE-TA Summary Report
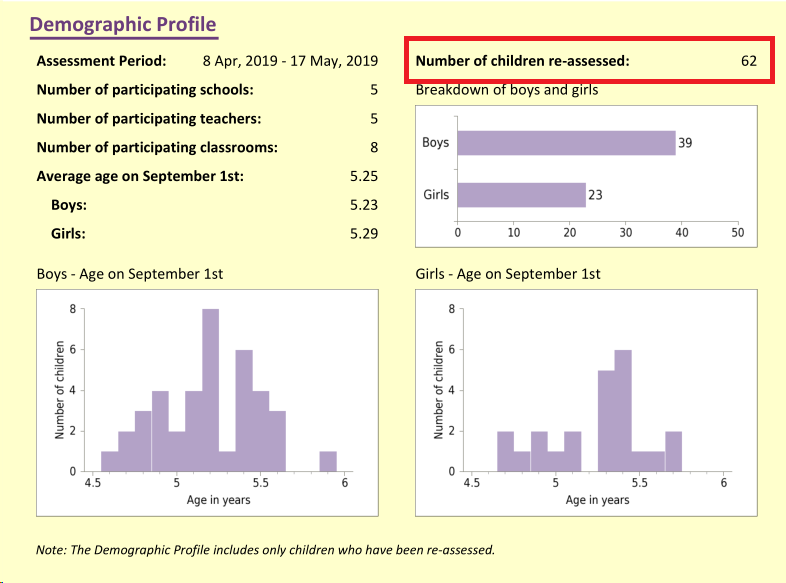
The primary point of confusion we've noticed is the difference between the "Number of children re-assessed" statistic in the Demographic Profile section of the report (page 1) and the total "n" value reported in the domain and RTI statistics further down in the report (Page 3, for example).
The disparity between these two totals is a result of children not being re-assessed in the post-assessment. The general recommendation for the EYE-TA is that children whose RTI scores in the pre-assessment fell in Tier 3 (red) or Tier 2 (yellow) categories should be re-assessed in the post-assessment and children whose RTI scores were in Tier 1 (green) category can be omitted. We assume the children who fell into Tier 1 during the pre-assessment would have continued to mature throughout the school year and would most likely have reached the limit of what the assessment can measure by the post-assessment window. Therefore, there is little value in re-assessing these children (unless the teacher deems otherwise) and we can give teachers a bit of a break on the assessment by leaving these kids out of the post-assessment data collection.
Please note that we still carry over the scores for the children who were not re-assessed into the domain and RTI Totals in the post-assessment summary report.
The Demographic Profile, on page 1 of the summary report, only looks at children who actively participated in the post-assessment. This means that the summary is looking at the children who were Tier 2 and 3 during the pre-assessment. Children who only had pre-assessment scores and were not re-assessed and therefore are not represented here. This section of the report is meant to provide general data about the cohort that might be useful to administrators independent of the assessment data.
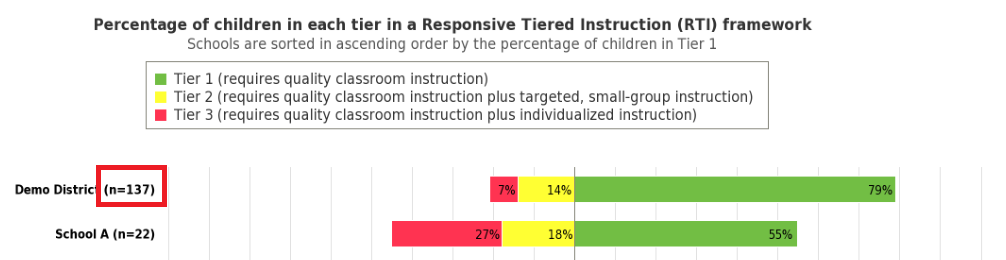
However, for page 3 and all other pages where stats from the domains and RTI are reported we include those children who were carried over from the pre-assessment in the totals (n values). This causes the numbers to increase significantly compared to the Demographic Profile total.